There is a practical way to tell if your energy yield is down to dust and dirt as opposed to an inverter fault, an export cap, shading or curtailment. You do it by pitting expected production against what is measured for solar irradiance and then have a soiling ratio, optical sensor or reference cells to back it up.
I am Evander Anderson. One has to spend time with the sort of machinery found on dry roads here in Australia that seems fine until it is not, and the sharp light we get. With solar panels the output can wane imperceptibly and soiling goes unnoted. The system is still churning out energy but in a manner that leaves money on the roof. This guide is to show how one measures that loss, gets to the root of it and makes a call on the cost and risk of cleaning.
The Effect Of Soiling On Output
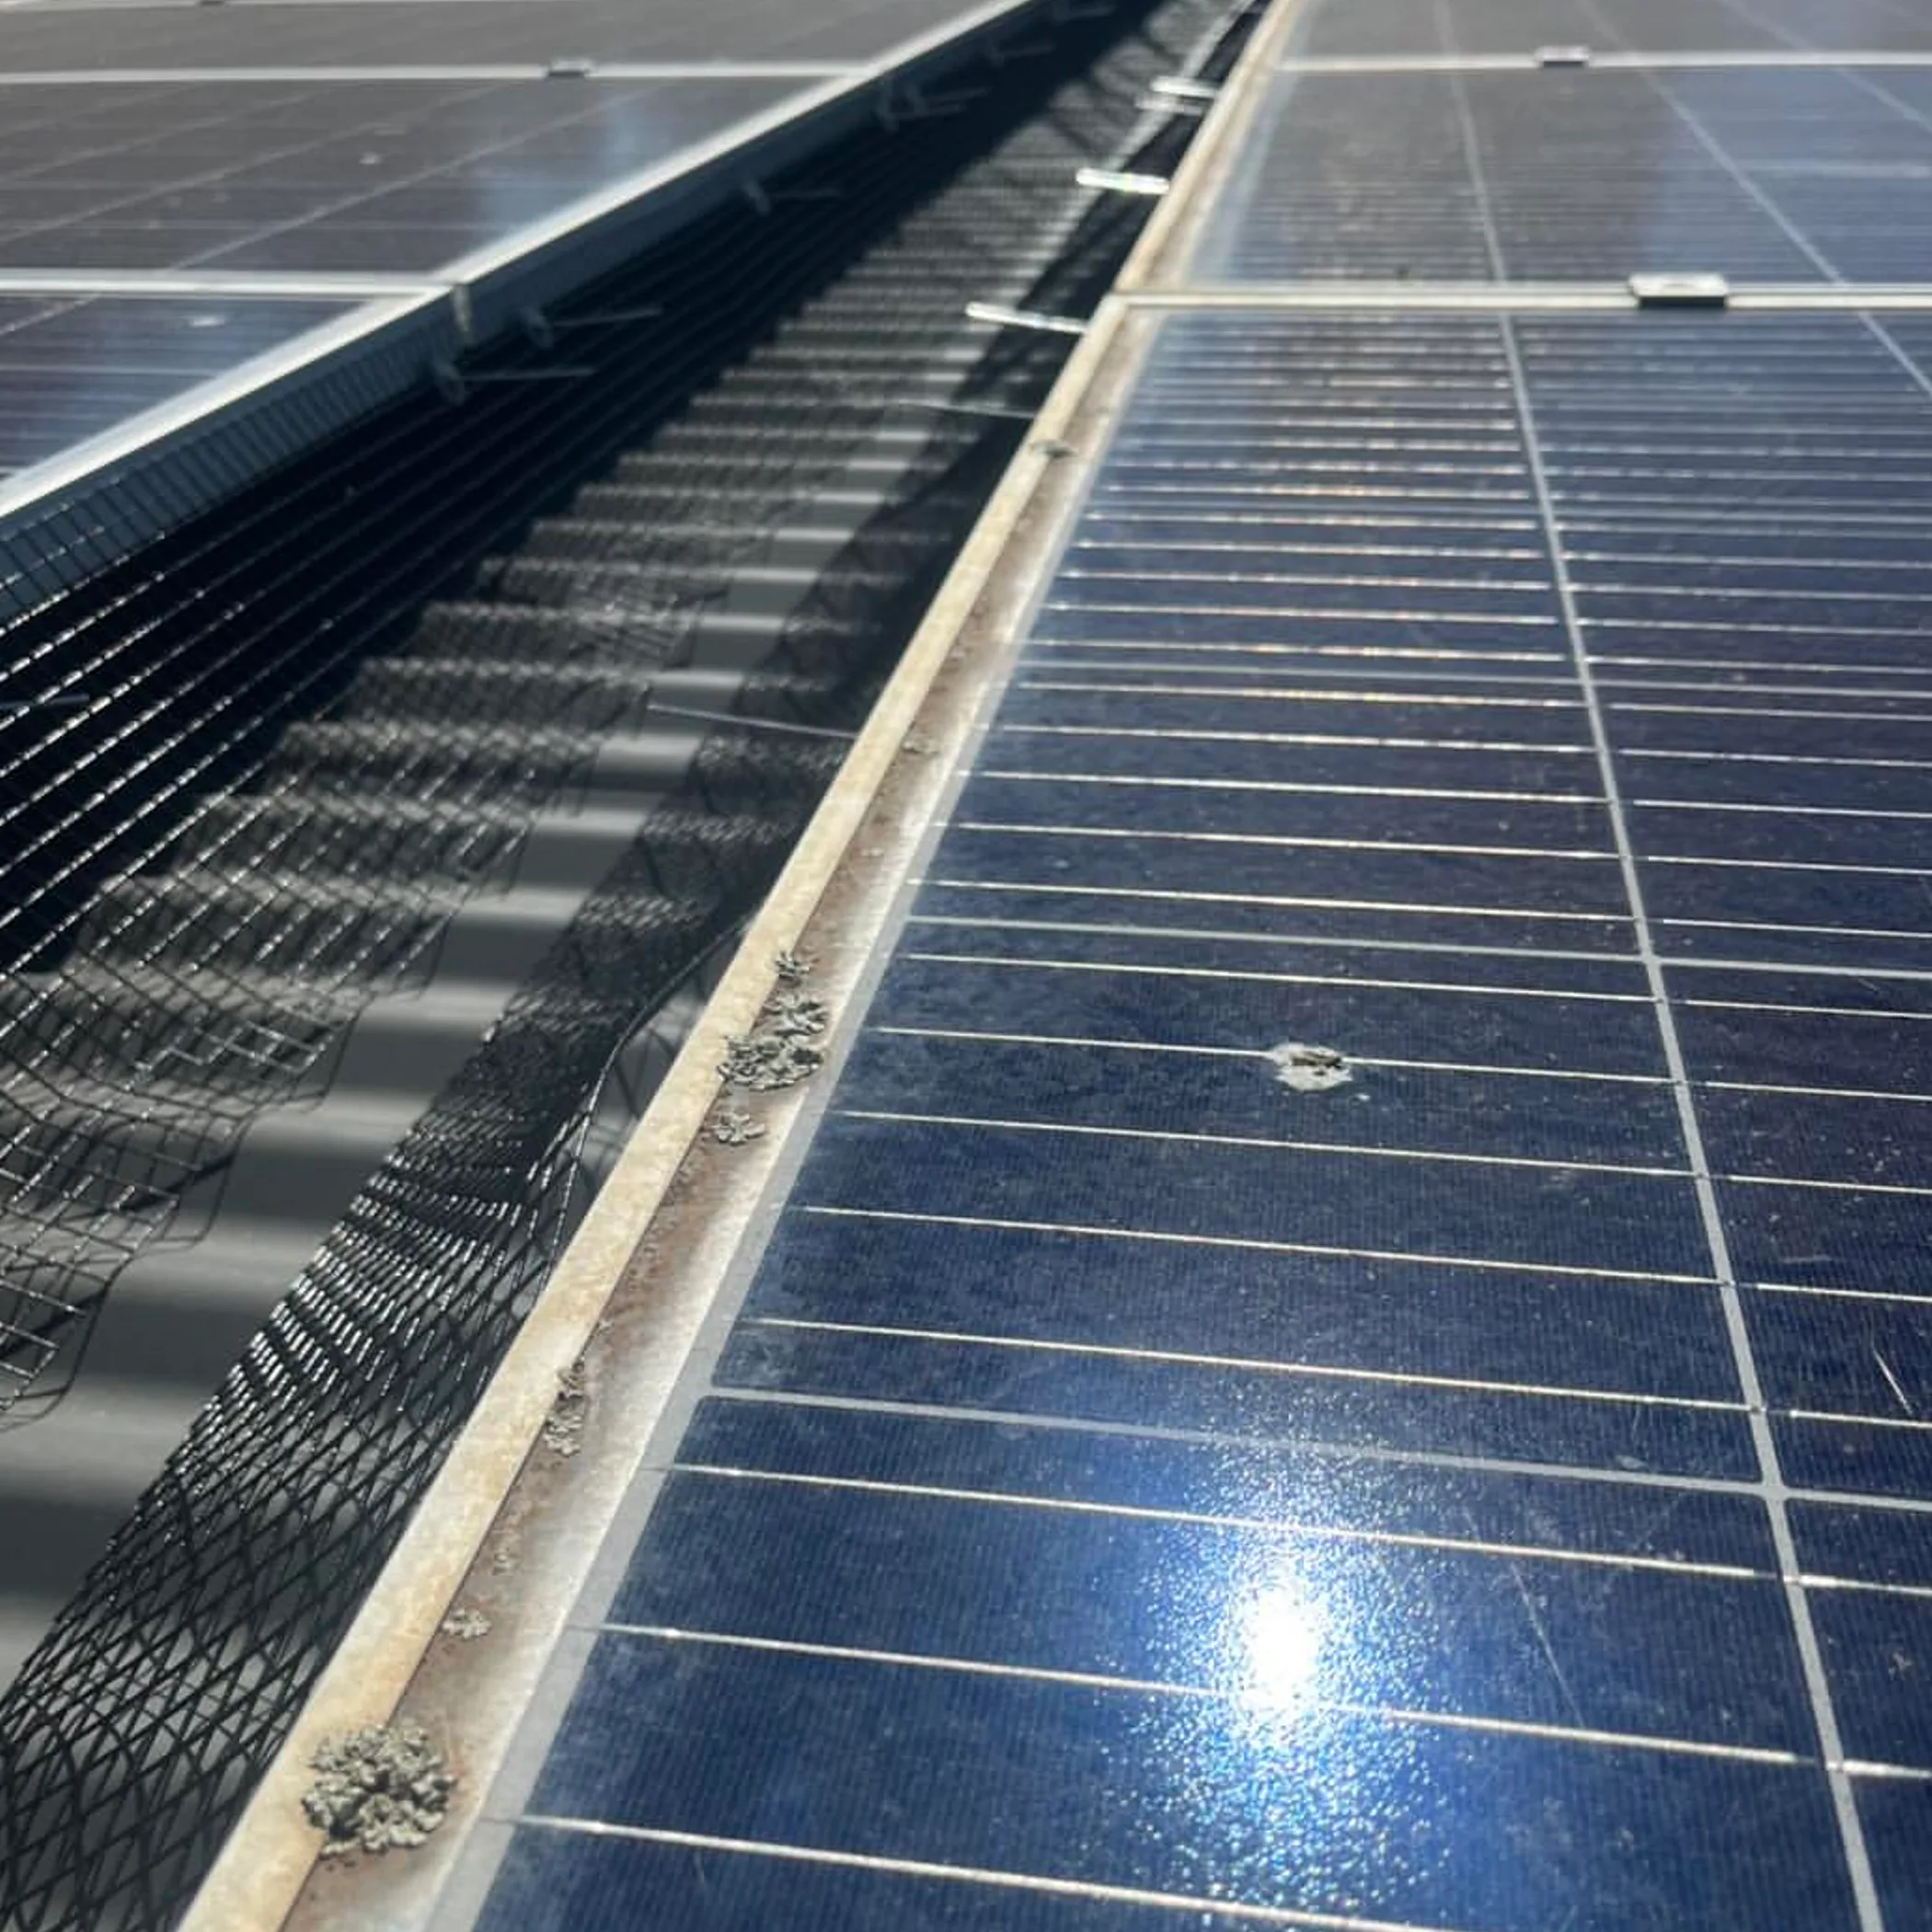
Put simply, soiling is the accumulation on a PV system’s front surface of everything from pollen and pollution to bird droppings. For more on soiling in Australian conditions, it scatters or blocks the sun from the cells, current is reduced and so is the yield.
You will not see the same loss on every panel. A film of fine dust will have an even hand over the array, a small bird dropping will put shade on a few cells. The distinction is important since uneven soiling is a recipe for hotspots, local electrical stress and monitoring numbers that do not tell the whole story.
Soiling Loss Explained
It is the gap in energy between what a clean system would give you in like conditions and what is actually produced. Put it in formula:
[1 − measured soiling ratio] × 100 = Soiling loss (%)
Take a soiled reference cell making 0.92 of the signal of a clean one under the same irradiance; the loss is 8%. That is off the clean reference measurement, not the electricity bill.
Do not think of it as some kind of average for Australia. Tilt, rainfall, farm work, pollen and the like all come into play. A flat roof off a busy unsealed track is not going to be in the same league as a steep residential one by the coast.
Diagnosing Why Production Has Dropped
Pattern recognition is where you begin. An equipment fault will be abrupt or intermittent, perhaps confined to a string; soiling is a gradual thing that shows up on clear days.
A day of cloud can make a sound system appear as rough as guts, so do not be swayed by one sunny afternoon. Look at several days with comparable temperature, irradiance and cloud cover.
Signals To Compare
Have a look at the inverter data, weather and array power. Should the performance ratio (PR) be in steady decline over a period of weeks with stable irradiance, soiling is a likely culprit.
See if the array as a whole is affected or just a particular inverter, string or part of the roof. The former would be environmental, the latter more indicative of a problem with a connector, optimiser, fuse or partial shading.
Rainfall is another indicator. Some light rain will leave its mark in the form of mud or minerals, though it may take some dust with it. A marked turnaround after a good clean is telling, if not absolute proof of where the kilowatt-hours went.
Measuring Loss With Performance Ratio
When the clouds are in charge, PR is a handy tool to separate a dirty array from bad weather. It is actual yield over the theoretical based on installed capacity and what has been measured, following the usual conventions for system and measurement. Keep the calculation the same; half-way through a trend one should not be changing the rules or the sensors and inventing a problem.
A Baseline You Can Trust
Get your PR figures from a time when the system was clean, say after a wash or a decent rain. Later on, use operating conditions and data of the same quality to make the comparison. A low value for a day is not as significant as a PR that has been declining. Take a system that puts on record an 82% PR for a clean period and then, in like conditions, 75%. The relative reduction would be put at some 8.5 per cent:
(82 − 75) ÷ 82 × 100 = 8.54%
One should not conclude this is the soiling loss without further cause; inverter clipping, heat, grid constraints or even a drifting sensor can have an impact on PR. Consider it a screening signal and wait for a measurement to bear it out.
| Observation | Likely Meaning | Useful Confirmation |
|---|---|---|
| A whole array’s PR in steady decline | points to dust or contamination of the surface | a post-clean recovery or reference cell comparison will tell |
| A string that has lost output all of a sudden | could be down to an optimiser, a connector or electrical fault | inverter alarms and string current will confirm |
| Where output is being held to a ceiling | look to the inverter or an export cap | cross check with AC power |
| If the loss is confined to part of the day | there may be an orientation effect or a tracker problem | compare the shade and hourly irradiance |
| If cleaning brings things back | you can be sure soiling was to blame |
Reference Cells Show The Difference
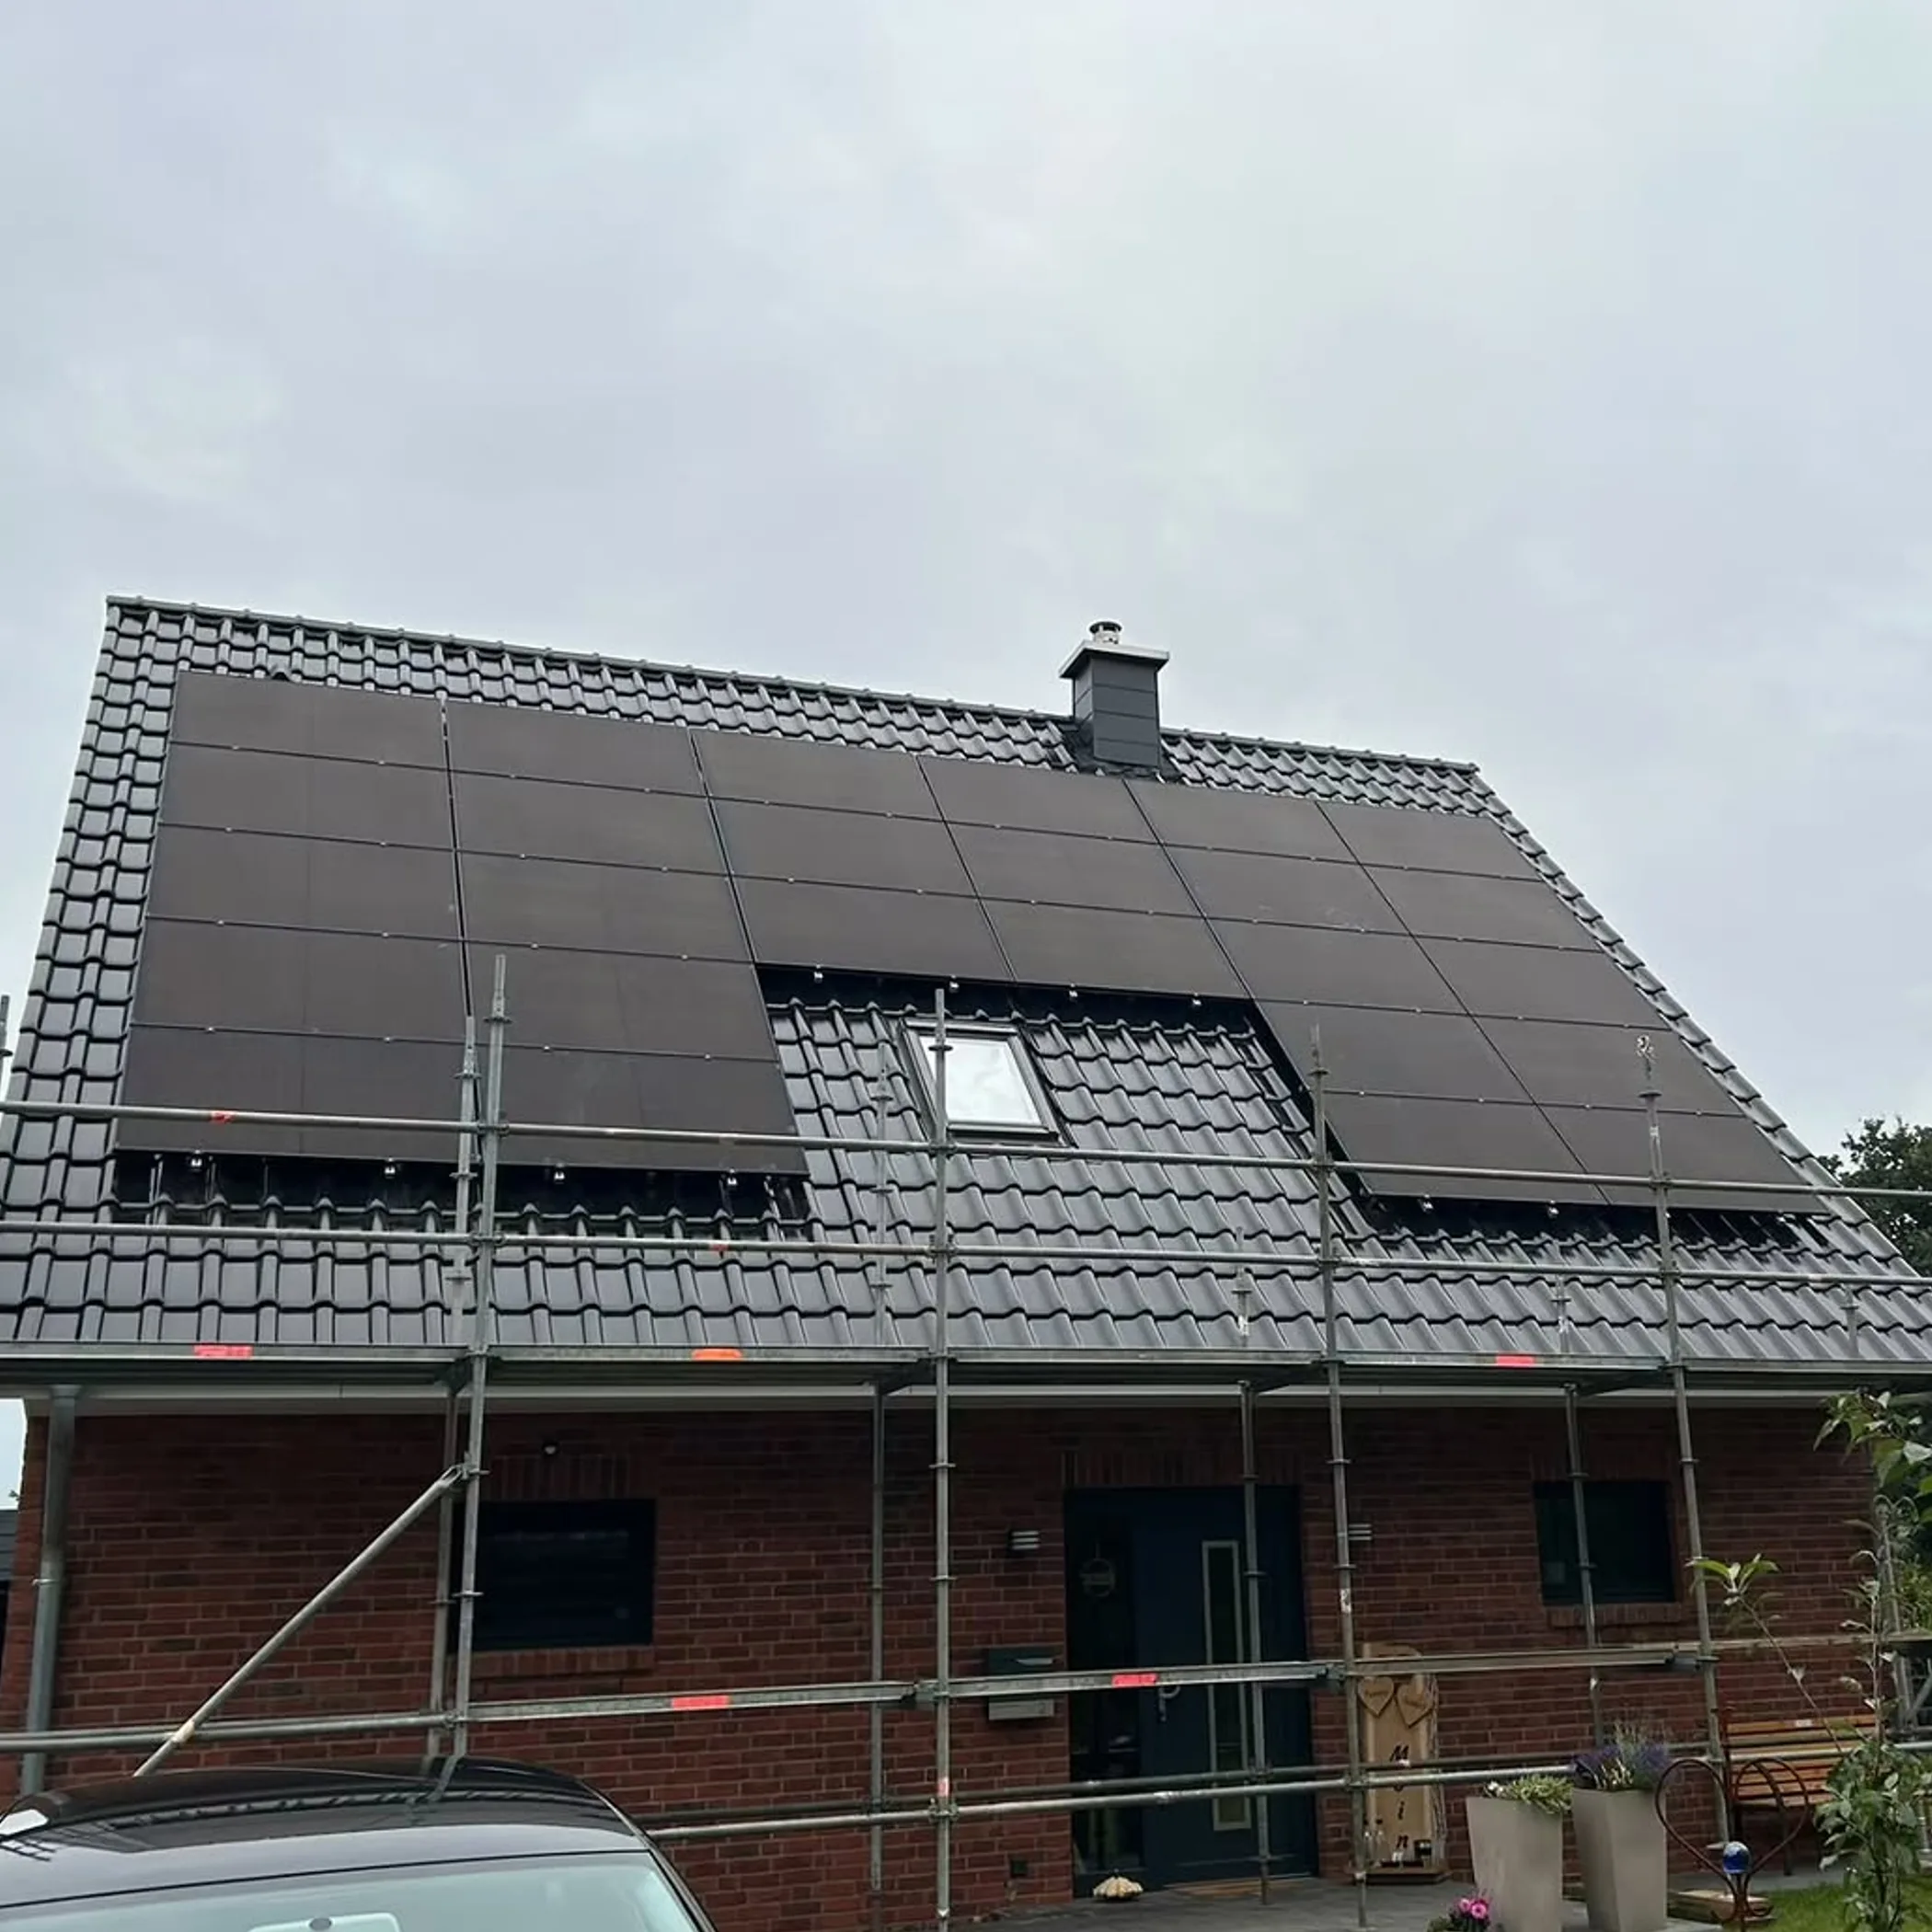
With one reference cell kept clean and another left to the elements as the PV array is, a direct comparison is possible provided they are of a like temperature and light and point in the same direction. The soiling ratio is found by pitting the irradiance response of the soiled cell against the clean one; any shortfall in reported light is an estimate of the optical loss from contamination.
Keep The Sensors Honest
The numbers from a reference cell can be deceptively tidy if the unit is sited behind a parapet or at a different tilt to the panels, or is given more of a wash than they are. One should also maintain records of cleaning, rainfall, bird activity and any odd occurrences such as earthworks in the vicinity. There is the matter of weather station bias too; an irradiance sensor in need of a clean can make the PR seem either better or worse than it is for no good reason.
For a residential installation of modest size the trouble of a calibrated reference cell may not be worth the while; in which case inverter data and photographs will do as well. But on a large commercial site where the cost of not producing is greater, permanent sensors are a sound investment.
Sensors And IV Checks
An optical soiling sensor is useful for making decisions on cleaning and automating alerts, especially on a site with hard-to-reach or extensive arrays in dry climes. Then there is IV curve monitoring of modules or strings to get at the current-voltage behaviour and put to rest any mystery over shading or degradation that an energy graph does not account for.
Match The Tool To The Site
If it is a home system and the issue is whether a dry spell has made a difference to performance, inverter monitoring will suffice. For a large, revenue-driven system where safe inspection is not easy, go with optical sensors and IV curve monitoring. Or for a repeatable soiling ratio, a pair of reference cells (clean and soiled) is called for.
But there is no point in putting in an expensive sensor and then neglecting its calibration and the quality of the data. It is akin to having a fine tyre gauge and never seeing if it is zeroed. Instrumentation is of use only when the trend is reviewed and action taken.
Separate Soiling From Other Causes
Diagnosing solar output is a process of elimination. Put off the wash until the inverter portal and alarm history have been checked and site conditions and network status assessed. An inverter fault will make itself known in a hurry, whereas soiling will take its toll on daylight production in stages. High temperatures alone can cut output on a hot day. And curtailment or an export cap will put a lid on the AC side regardless of how much DC the panels are turning out.
- Run through the inverter for shutdowns, communication gaps and string-level warnings.
- See if there is new shade from a tree or some roof equipment.
- Check for hotspots, animal damage, loose cabling or cracked glass.
- Make a comparison of clear-day production before and after a rain or a clean.
Above all else, safety. Do not go up on a roof to have a look at the panels unless one has the training and fall protection and is mindful of the electrical hazards; live equipment and wet or fragile roofing do not mix. On a commercial site, leave the tests that mean isolation or opening up equipment to a qualified technician.
Australian Soiling Patterns
The extent of soiling in Australia is a matter of season and where one is. In arid country you will see fine dust put down over the course of a dry spell, agricultural districts will have their share of pollen and crop residue from the soil. The Pilbara and some of inland WA are prone to hard dust events; in the Top End the wet season can wash the panels but is apt to put down its own organic residue.
Coastal sites may find salt and airborne pollution mixing with the dust. Regular rain in an urban setting does not preclude localised contamination from bird activity or what traffic leaves behind. Then there is the Stuart Highway or a construction site in the vicinity which can be more of a factor than the region would suggest.
Do Not Count On Rain To Clean
Rain might get at the loose dust yet a light shower is more likely to make a mess of streaks. After a long dry run the first rain can reduce it to a thin paste. One should check the array rather than presume the matter is attended to.
Maintenance is also dictated by cyclone alerts up north from November to April. A storm will deny safe access and the wind will put debris in your path. Bushfire smoke and ash present another form of short term contamination. Put these down next to your production data to put any odd losses in perspective.
Make Cleaning An Economic Decision
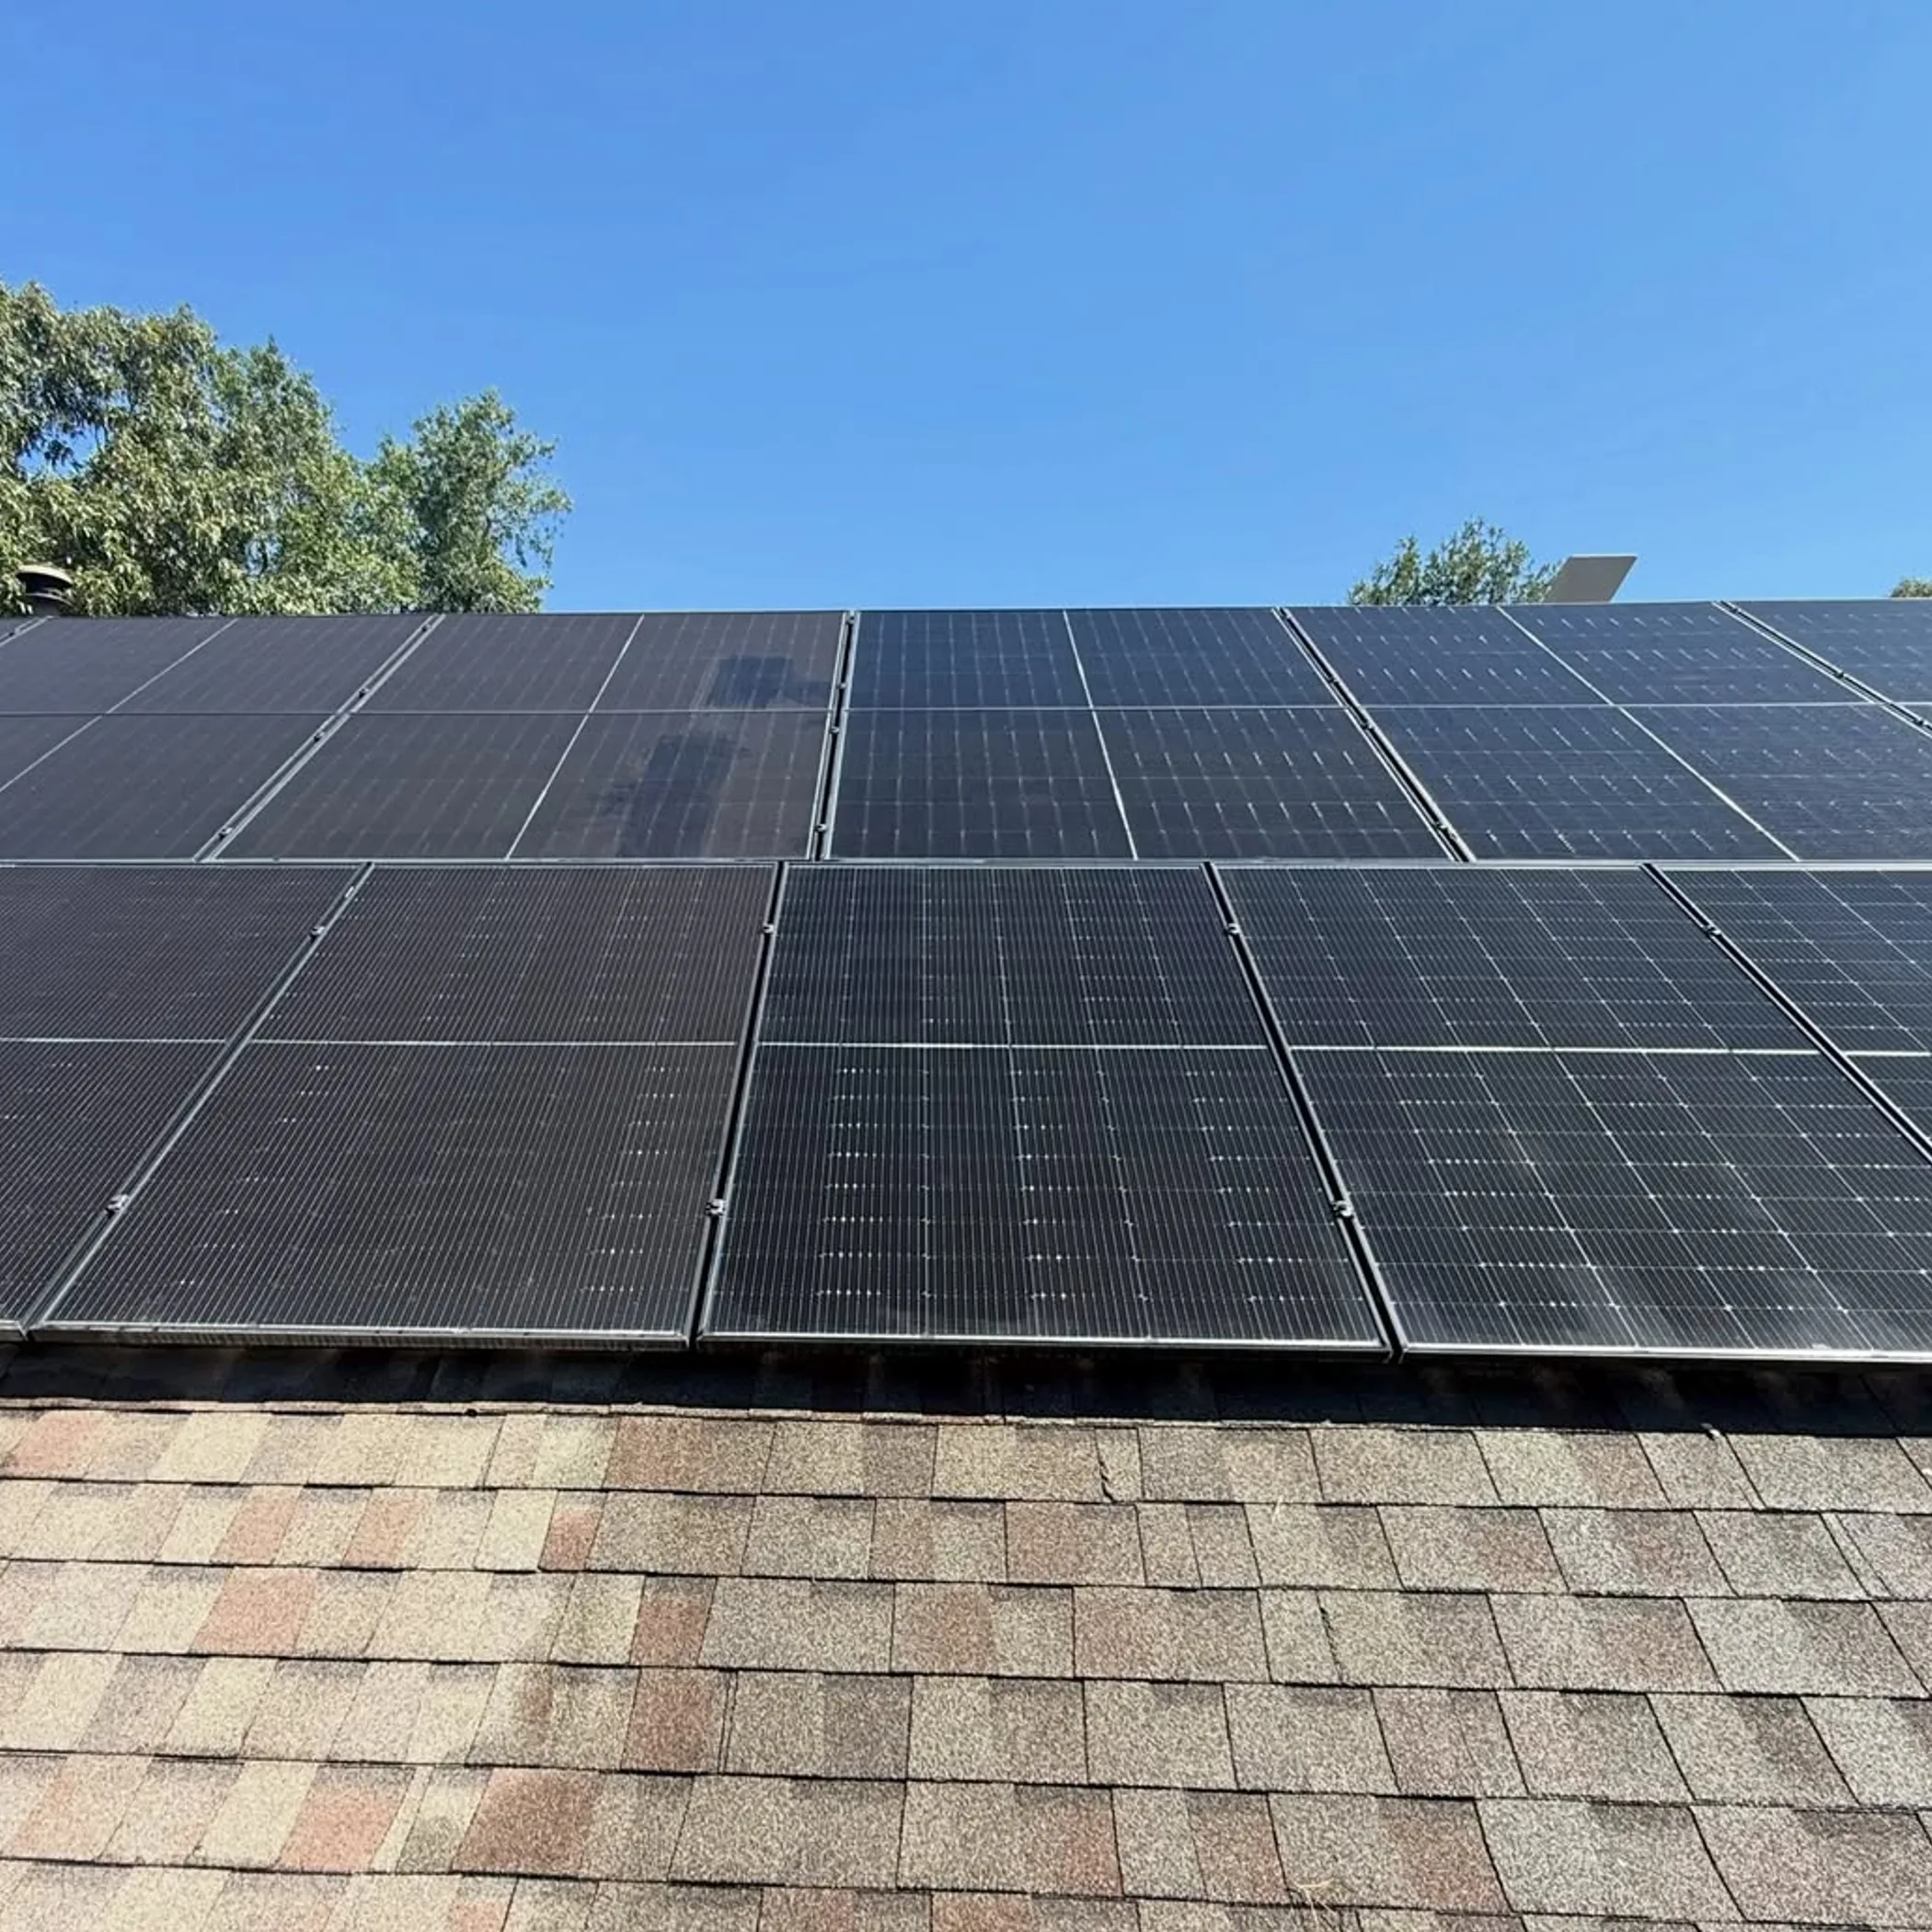
Let measured loss dictate your schedule, not routine. You do not want to be spending water and roof time on a monthly basis for no reason, but then again leaving an array to underperform for months is not an option either.
There is a threshold where the energy you put back is worth the risk and cost of cleaning. Factor in everything: the labour, equipment, downtime, traffic control and the possibility of damage. If a man falls or puts a scratch in the glass or a connector, that cheap wash was not so cheap after all.
A Checklist For The Site
- Record the date and the soiling ratio, be it measured or an estimate.
- Have a look at recent conditions: rainfall, dust, smoke, birds and the like.
- Make an allowance for the output you could recover.
- Set that against the quotation and any risks in getting there.
- Where you can, clean off a section as a test and see how the production compares.
For a home owner a qualified cleaner will come in at a modest fee though one price does not fit all given the system size and roof height. Get a written figure in Australian dollars and be sure the worker has the right insurance and whether water treatment is part of the deal. Leave the pressure washer and abrasives alone unless the manufacturer and a technician are in agreement.
Where Owners Go Wrong
It is easy to put low winter or cloudy day production down to dirt. Or to take a monitoring app’s forecast as gospel when in fact the inverter data and sensor placement have their limitations. Some will go after the obvious bird droppings and miss the fine film on every panel that is costing them more. And a panel can appear spotless and still have a fault under the glass or mineral deposits you cannot see.
In my experience of pitting field readings against the charts the problem is frequently not with the panels. A communications glitch, a shaded irradiance sensor or an export setting will make the array seem at fault. The unexciting checks are what clear it up.
Some Common Questions
How much of an effect does soiling have?
You will not find a percentage that fits the bill for every site. It is a function of the angle of the panel, the dust loading, the type of contamination and so on. Do better to measure the loss with a soiling ratio.
What of the 33% rule?
Not a rule to be applied to soiling or system performance. It is an informal number thrown around in other solar design or financial talk. Use the economics and the numbers for your soiling decisions.
What constitutes soiling loss?
Any material on the surface, be it dirt or residue, will block or scatter the sun and lower potential production. A soiling ratio is the usual way to put a figure on it.
Why is my output so poor?
Could be an inverter or wiring issue, curtailment, heat or shading. See where and when the loss is. A whole array going down gradually in dry weather is indicative of soiling, a sudden loss in one string calls for an electrical look in.
After the rain?
Have a look. If the figures are below your clean baseline and you have met the economic case for it, have a professional put it right in a safe manner.
Monitoring Should Lead To Action
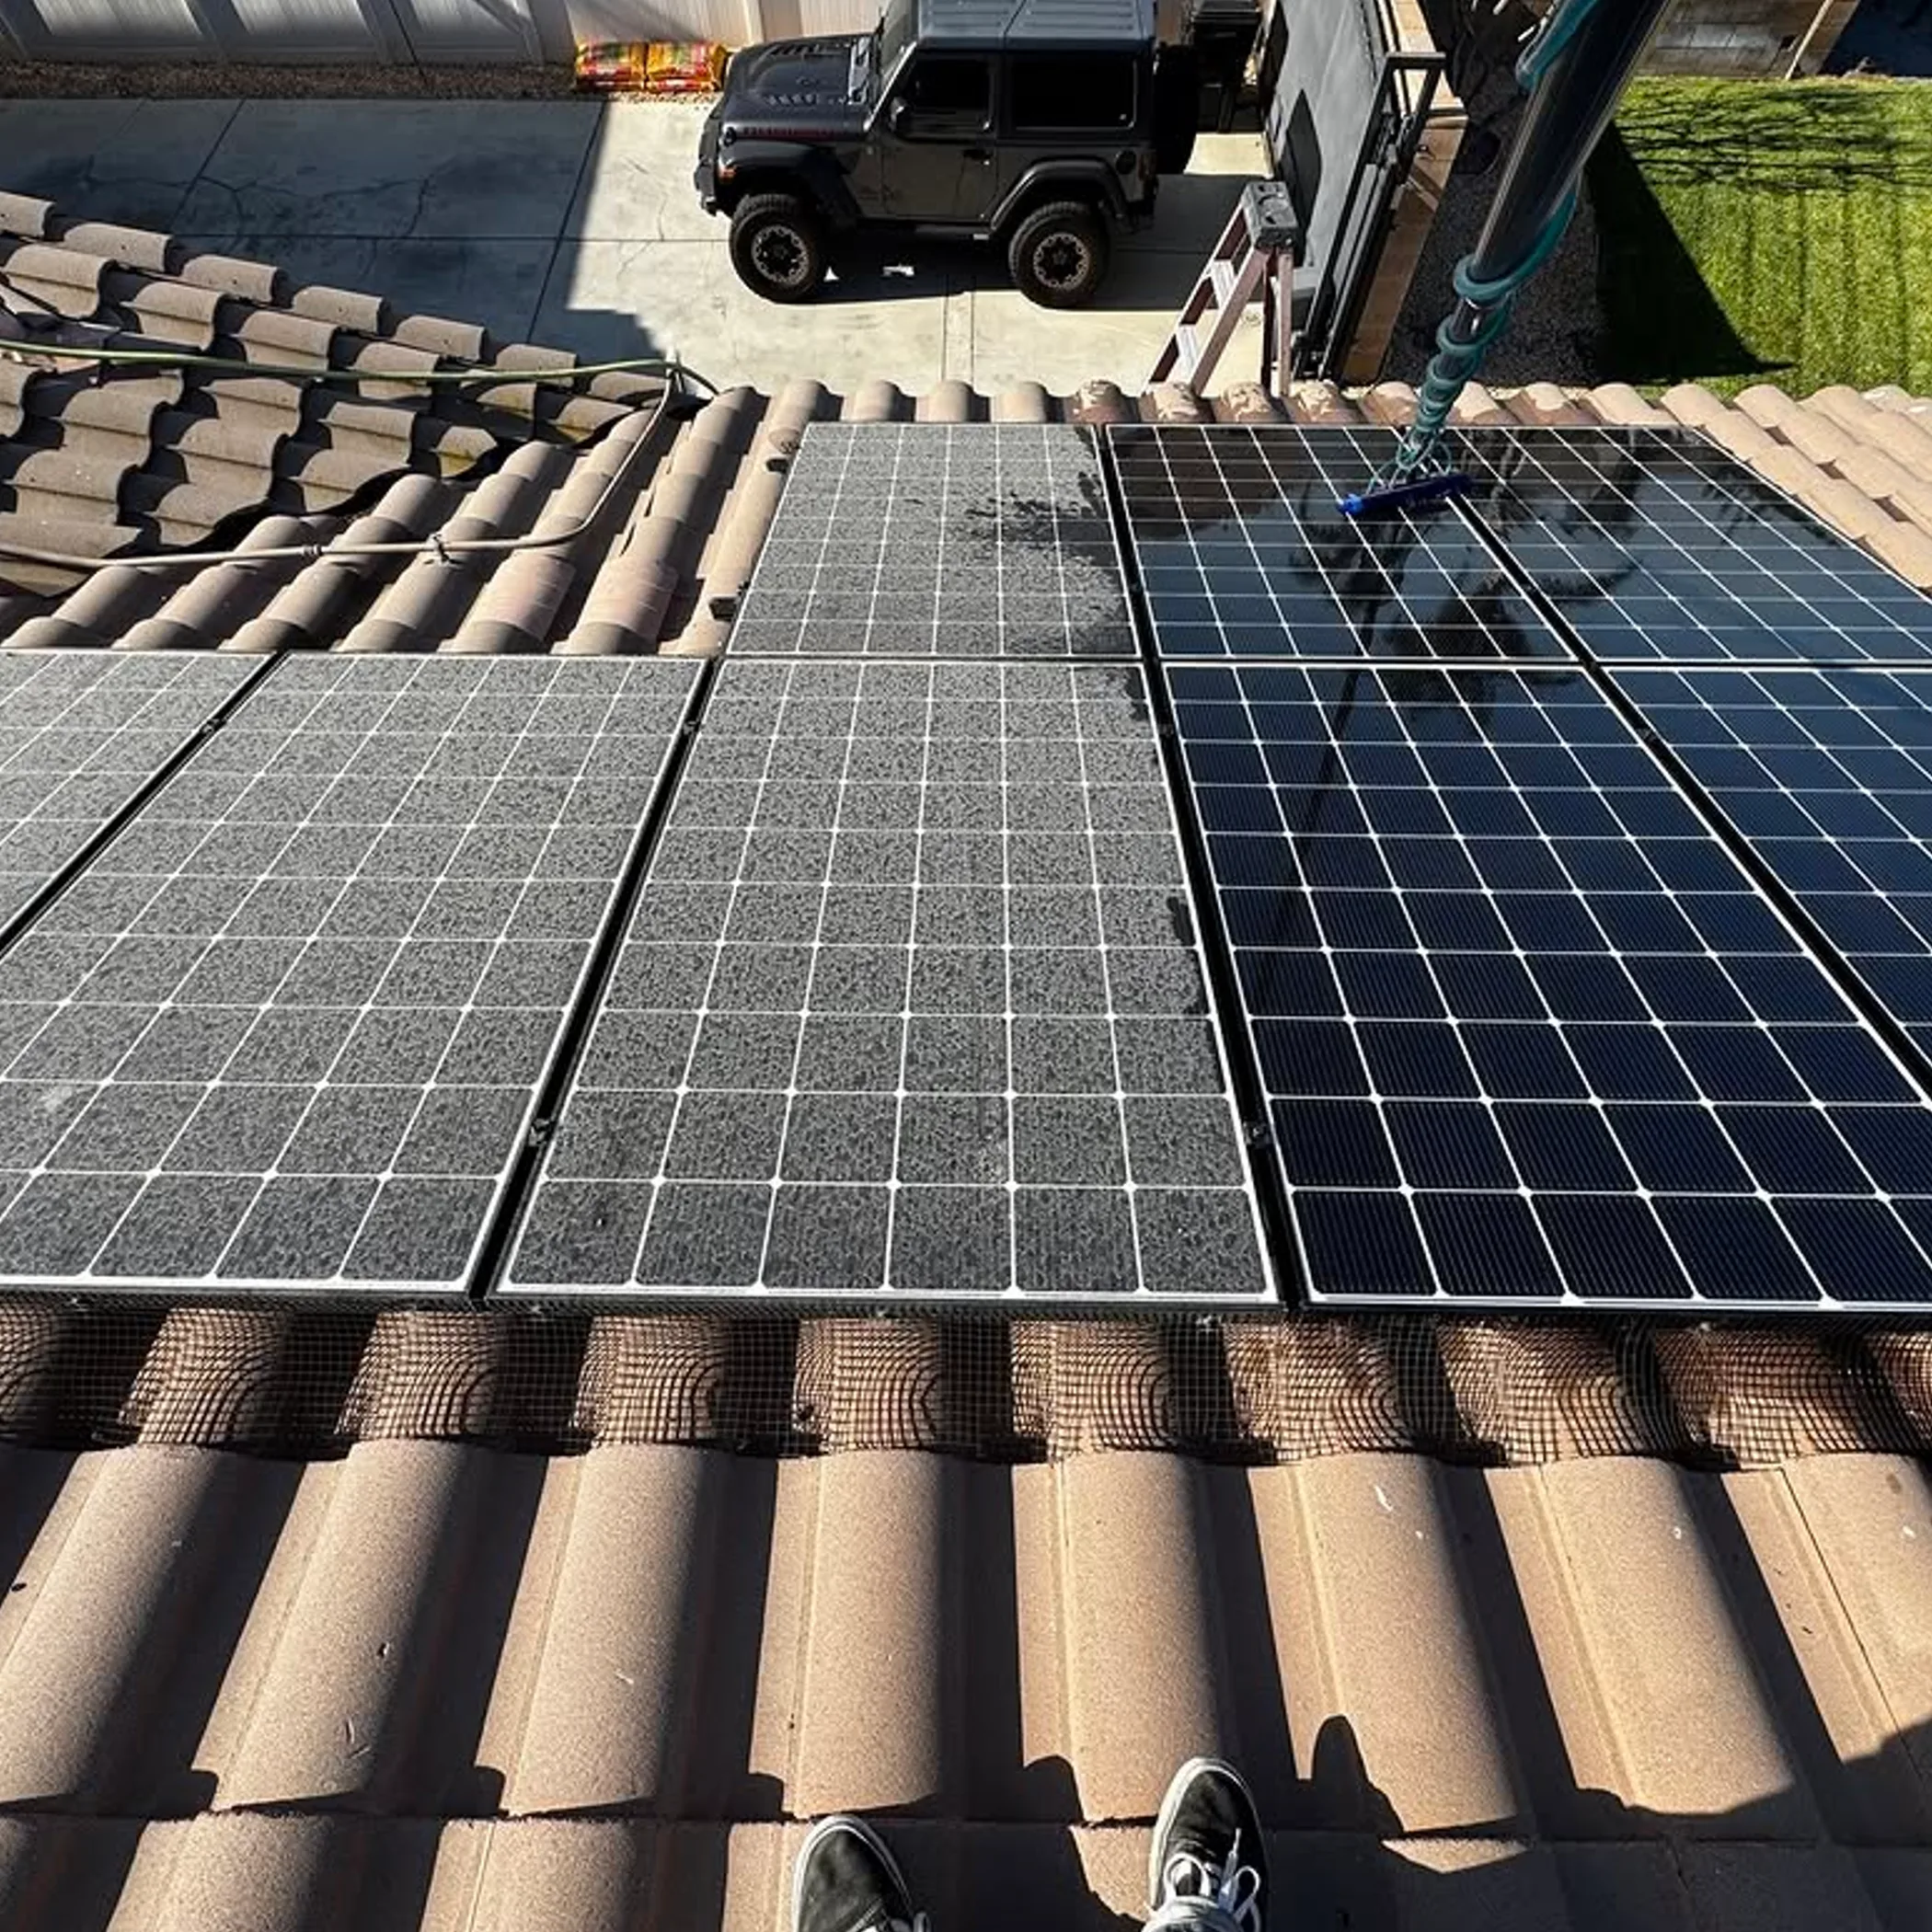
With proper monitoring of yield, PR, weather and the like a complaint is made into a decision you can stand by. A reference cell or controlled test will confirm if the soiling is real.
One can review the IEA PVPS resources for the technical side of things. But the point is to measure the trend and only clean when the output recovered is commensurate with the risk. There is no convicting a dirty panel without proof. With the variable conditions of Australian weather and dust a good record of monitoring will put guesswork out of a job.
